Brain-Trainer Assessment System
The Assessment Problem
Trying to describe a dynamic, complex chaotic system like a brain with static numbers is like trying to describe a 30-minute sunset with a snapshot. Still, brain-based neurofeedback training is, in our experience, the best way to maximize effectiveness while minimizing negative responses. For that reason, Brain-Trainer’s TQ8 provides a full QEEG (quantitative EEG) to determine what and where to train.
What is a QEEG?
QEEG’s record data from 20 or more standard EEG sites on the head. This is done during eyes-closed, eyes-open and task conditions. The result is a picture of how brain activation changes from resting to awareness to active processing states. The Q removes “artifacts” (electrical signals in the EEG which do not come from the brain) and presents the data in terms of the main measures of brain activity: frequency, amplitude, stability and connectivity.
Any QEEG system performs these basic functions. Most use some form of Electro-Cap to speed up hookup and recording. Most have some form of artifacting routine as well. Ideally the data are recorded, cleaned and loaded in less than 30 minutes.
Making Sense of the Data
There are two major approaches to looking at all this data:
Population-based: Compares hundreds of measures from the client against a database of people recorded over the past 30 years to produce dozens of “z-scores”—specific measures in specific areas of the client’s brain which differ from “average”. Whether these differences are positive or negative, adaptive or mal-adaptive is not clear.
Pattern-based: Identifies Stable Activation Patterns that have been linked in QEEG research to problem areas in a person’s life. These were developed by comparing people with specific training issues (e.g. anxiety, ADHD) against the population to see where they reliably differ. If a pattern present in the client’s brain is consistent with the training goals, training to change the pattern can be expected to change the mood, behavior, performance or symptom.
The Importance of Artifacting
We strongly recommend that ALL session data be artifacted before being processed by the TQ8 Assessment.
EEG recording has the potential to record sharp spikes in amplitude, which are usually related to eye blinks, muscle movements or other non-brain-related sources. Only if you remove this artifact activity, will you have an accurate picture of the trainee’s EEG and be able to make good training decisions.
You have several options for artifacting, depending on the software you are using and how much of it you want to do yourself.
TQ8 —The Trainer’s Q
At Brain-Trainer we believe “Less is More”. Population-based QEEG’s are great for research, but they cost more, take longer and don’t focus on your practical questions. They can’t distinguish between useful and problematic variances, so they risk training down the client’s strengths. By skipping the database, the TQ8 leaves out the mountains of data and the focus on “average” to identify those tendencies related to training goals. You can gather, artifact and load the data from 20 sites in 25 minutes and produce a Whole-Brain training plan and Client Pattern Summary within 3-5 more! There’s less unnecessary data, less chance of negative response, less processing delay and fees. That means more focus on critical training issues, more immediately, and more cost-effectively in a complete, integrated assessment and training system that leaves $4,000-$8,000 MORE in your pocket!
If you will be working with multiple clients, the TQ8 Trainer’s Q is faster and more cost-effective.
TQ8 works with Brain-Trainer for BT2, BioEra and BioExplorer. It can be recorded in 2 or 4 channels at a time. The Assessment is an Excel 2010 instrument, which will normally work with Excel 2007 and later. Data are exported from your EEG software and imported to the spreadsheet.
Whole-Brain Training Plan Service
You send TQ Assessment data, Client Report form, and session files, and TQ assessment specialists will artifact your data, complete the latest TQ Assessment file, and develop a training plan.
Assessment Views
Analyze Page
The Analyze page (small section shown here) summarizes findings from the full assessment and identifies in a single display the training categories that suggest potential problem areas. Red numbers indicate values higher than expected, blue numbers values lower than expected.
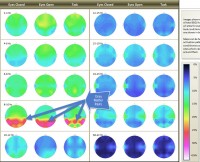
Frequency Distribution Maps
Maps show the % of brain activity at 10 key frequencies around the brain and how patterns change in eyes-closed and eyes-open resting states and at task.
These can be helpful in getting an overview of the brain’s “style” and identifying areas where there may have been injuries or damage. Brighter colors represent higher percentages of total EEG at a site in a particular frequency.
Heads Display of Absolute and Relative Amplitudes
The Heads displays array data around the head, color-coded by frequency, to make it easier to compare absolute values (left head) and relative values (right head).
By clicking the buttons at the bottom of the page, the trainer can see data for Eyes Closed, Eyes Open or Task. This page is especially helpful in comparing beta or alpha values between sites, and for judging overall levels of fast activity.
Histograms
Histograms compare left and right amplitudes in 10 frequency bands for each brain area during eyes-closed, eyes-open and challenge conditions. With the click of a mouse, the graphs can add or remove conditions—or even focus on one hemisphere.
There are three histogram pages. The Amplitude histograms, a portion seen here, show the distribution of amplitude among all frequencies at each site. Symmetry issues and reverse activation are easily seen.
The Variability histograms show, for each site, the amount of amplitude variation in each frequency band during each of the three conditions. High levels of variability indicate limited control. Brains showing extremely low variability may suggest excessive control.
The Symmetry histograms show differences in amplitude between the two members of a site pair in each frequency in each condition. Generally amplitudes should be symmetrical between site pairs. Small values indicate symmetry, large values suggest Channel 1 (large positive) or Channel 2 (large negative) is dominating.
Report Pages
The Report pages are color-coded tables of important data. Measures are arranged so that red numbers suggest readings higher than expected and blue numbers suggest readings lower than expected. Data is given for all sites under all three conditions.
The Report page, a portion seen here, provides frequency band ratios known to be important, such as the Beta/Theta and Alpha/Theta ratios. The peak frequencies within the middle, fast, and overall bands are also shown.
Synchrony Pages
Synchrony is the brain’s ability to communicate efficiently within itself. The Synchrony page shows levels of coherence and phase locking between the two members of a site pair, e.g., left and right front, for all frequencies, sites and conditions. High levels of fast-wave coherence or low levels of slow-wave coherence are identified with color coding.
Brain Patterns on the TQ
TQ8 Trainer’s Q with AutoPlan
For BT2, Brain-Trainer for BioEra and BioExplorer