Graphing and Charting versus Real Life
Graphing and Charting versus Real Life
Most people want to become less anxious, or pay attention better, or sleep more effectively, or stop obsessing over things or whatever. If they are showing better average scores in their sessions, but those things aren’t changing, do you really think you can convince them the training is “working”?
The problem with using scores is that, depending on what designs you are using, chances are the targets are reset at the beginning of each session, and some may even be in automatic mode, so the points won’t necessarily change from session to session regardless of how well your brain is changing.
Back in the early 90s, when I began training with Joel Lubar as my mentor, he used % success as a measure that made really nice graphs over a series of sessions. In order for that to work, though, we had to set a target for theta and another for beta at the beginning of training–in the first session–and leave those targets stable throughout 20-40 session. Some days the brain would be so far away from the target that the client got virtually no feedback and the session was relatively useless; other days he was scoring 90% of the time or more, and again there wasn’t much “learning” involved in the session.

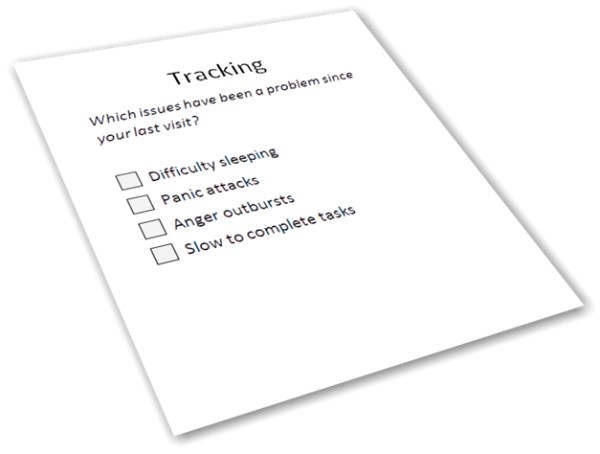
I prefer to ask them how they know (when we start) that they are depressed or impulsive or whatever–make a list of those things–and then track them every week (or however often you agree). How do you know you need to be better at concentrating? I read an email from my boss or an article at work or a homework chapter, and I have to read it 3-4 times to understand it. Track that. See if it’s changing.
If you focus on those real-world things you want to change, set objective measures for them and track those week by week, you’re likely to have a lot more useful assessments of success.
One of the great disappointments that many have when starting to do QEEG’s is that–even with all that data and analysis–if you look at pre and post Q’s of someone who has made significant, widely-recognized changes, you often can’t identify exactly how the brain changed. I suppose you could take a series of very sophisticated measurements of the body of a child as she made several attempts to ride a bicycle, and I’ll bet you wouldn’t be able to identify what changed between the last failure and the first success–maybe not even between when she couldn’t ride and after she’d been riding for a month. That doesn’t mean it didn’t happen.
I understand that there are many people in the field who are dying to have the graphs and the numbers, and I don’t begrudge them that. I spent lots of time in my early years looking at that stuff, long enough to convince myself that there was a poor registration between the numbers and what I cared about. Too many false positives (great graphs that didn’t result in change) and false negatives (horrible graphs in clients who made dramatic changes). So I stopped spending my time on that. You may be right that until you have trained enough people to see into the mystery of what is happening, had enough successes to trust the process, and gained some confidence (often as a result of training your own brain!) you really want those numbers as a way of convincing yourself you’re not a charlatan. And it may be, as suggested, that the numbers can be motivational for some clients and trainers.